This document continues from the previous section, explaining how to process parsing results after obtaining them and draw text boxes at corresponding positions on the original file.
This document uses this sample document as an example to explain how to draw text boxes on the original file image.
Please install dependencies before running the example code: pip install PyMuPDF pillow requests

Example Code

import requests
import json
import os
import fitz  # PyMuPDF
from PIL import Image, ImageDraw

ti_app_id = "your_app_id"
ti_secret_code = "your_app_secret"
workspace_id = "your_workspace_id"
file_id = "your_file_id"

host = "https://docflow.textin.com"
url = "/api/app-api/sip/platform/v2/file/fetch"
params = {
    "workspace_id":workspace_id, 
    "with_document": "true", 
    "file_id":file_id
    }
resp = requests.get(url=f"{host}{url}", 
                    params=params,
                    headers={"x-ti-app-id": ti_app_id,
                             "x-ti-secret-code": ti_secret_code,
                             })
resp_json = json.loads(resp.text)

def extract_pages_from_docflow(document):
    pages_out = []
    for page in document.get("pages", []):
        pages_out.append({
            "width": page.get("width", 0),
            "height": page.get("height", 0),
            "angle": page.get("angle", 0),
            "lines": page.get("lines", [])
        })
    return pages_out

def pdf_to_images(pdf_path, output_dir="./docflow_pages", dpi=144):
    os.makedirs(output_dir, exist_ok=True)
    doc = fitz.open(pdf_path)
    zoom = dpi / 72.0
    mat = fitz.Matrix(zoom, zoom)
    image_paths = []
    for i, page in enumerate(doc):
        pix = page.get_pixmap(matrix=mat)
        img_path = os.path.join(output_dir, f"page_{i+1}.png")
        pix.save(img_path)
        image_paths.append(img_path)
    doc.close()
    return image_paths

def draw_quads_on_image(image_path, quads, page_width, page_height, color=(26,102,255), line_width=2):
    image = Image.open(image_path).convert("RGB")
    draw = ImageDraw.Draw(image)
    img_w, img_h = image.size
    scale_x = img_w / page_width if page_width else 1
    scale_y = img_h / page_height if page_height else 1
    for q in quads:
        pos = q.get("position")
        if pos and len(pos) == 8:
            points = [
                (pos[0]*scale_x, pos[1]*scale_y),
                (pos[2]*scale_x, pos[3]*scale_y),
                (pos[4]*scale_x, pos[5]*scale_y),
                (pos[6]*scale_x, pos[7]*scale_y),
                (pos[0]*scale_x, pos[1]*scale_y)
            ]
            draw.line(points, fill=color, width=line_width)
    out_path = image_path.replace('.png', '_boxed.png')
    image.save(out_path)
    return out_path

# Select the original PDF to visualize (same file as parsed)
pdf_path = "./simple.pdf"  # Please replace with your original PDF path

# Extract coordinate data
files = resp_json.get("result", {}).get("files", [])
if not files:
    raise RuntimeError("No file parsing results obtained")
document = files[0].get("document", {})
pages = extract_pages_from_docflow(document)

# Convert to images and draw coordinates
image_paths = pdf_to_images(pdf_path, output_dir="./docflow_pages")
annotated = []
for i, page in enumerate(pages):
    if i >= len(image_paths):
        break
    out_path = draw_quads_on_image(
        image_paths[i],
        page["lines"],
        page["width"],
        page["height"]
    )
    annotated.append(out_path)

print("Annotated images output:", annotated)
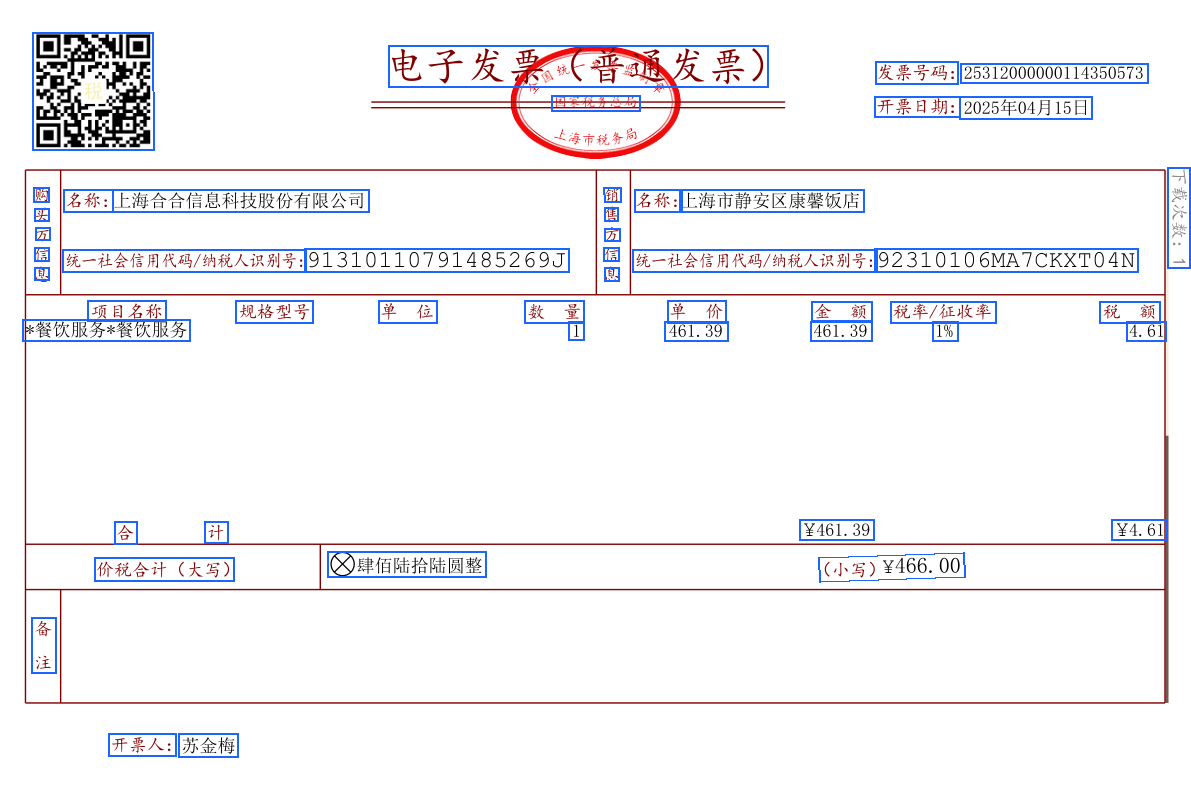
In the output directory, you can see the rendering effect of text boxes: visualization

Example Code Logic

  • Get parsing results: Call the result retrieval interface with with_document=true enabled to get result.files[].document.
  • Extract pages and coordinates: Read width/height/angle and lines[] from document.pages[]; each line.position is [x1,y1,x2,y2,x3,y3,x4,y4] clockwise four-point coordinates.
  • Prepare base image: Use the same file as parsing to generate page images. If converting images yourself, remember to record the rendered img_width/img_height.
  • Coordinate scaling: Calculate scale_x = img_width / page.width, scale_y = img_height / page.height, and scale the returned coordinates proportionally to the base image pixel coordinate system.
  • Draw visualization: Draw the scaled four points as closed polylines (or filled polygons) on the corresponding page image line by line, with configurable line width, color, and transparency.
  • Output and display: Save annotated images, or overlay rendering in frontend canvas/SVG/Canvas; ensure page-by-page correspondence.
  • Optional enhancements:
    • Handle angle rotation: If the base image is not rotated correctly, coordinate rotation correction based on page.angle is needed.
    • Multi-type coloring: Different element types can use different colors/legends; if there are table, image, and other types, they can be differentiated as needed.
    • Character-level highlighting: If charPositions is returned, scale each character coordinate proportionally and draw for more refined echo effects.
    • Performance optimization: Batch drawing, resolution trade-offs, on-demand page rendering to avoid processing too many pages at once causing lag.
    • Robustness: Null value checking, coordinate boundary clipping, fault tolerance for network/parsing exceptions.
The above process is language-agnostic. When implementing in other languages, you only need to replace the libraries and APIs for: HTTP requests, JSON parsing, image drawing, and coordinate scaling.